Search Console
Know what it costs, and whether the fix worked.
/shop/cold-brew lost 41% of its clicks
Fernhill Coffee · fernhillcoffee.com/shop/cold-brew
2,013from 3,412
40.8Kfrom 41.2K
4.9%from 8.3%
2.6from 2.4
- Not a tracking problem. Impressions held steady (−1%), so the page is still indexed and shown.
- The listing is losing clicks. CTR fell from 8.3% to 4.9% while position barely moved (2.4 → 2.6).
- Not a blip. The drop began on Oct 2 and has held for 26 days.
1 Google Search Console · Sep 30 – Oct 27 vs Sep 2 – Sep 29
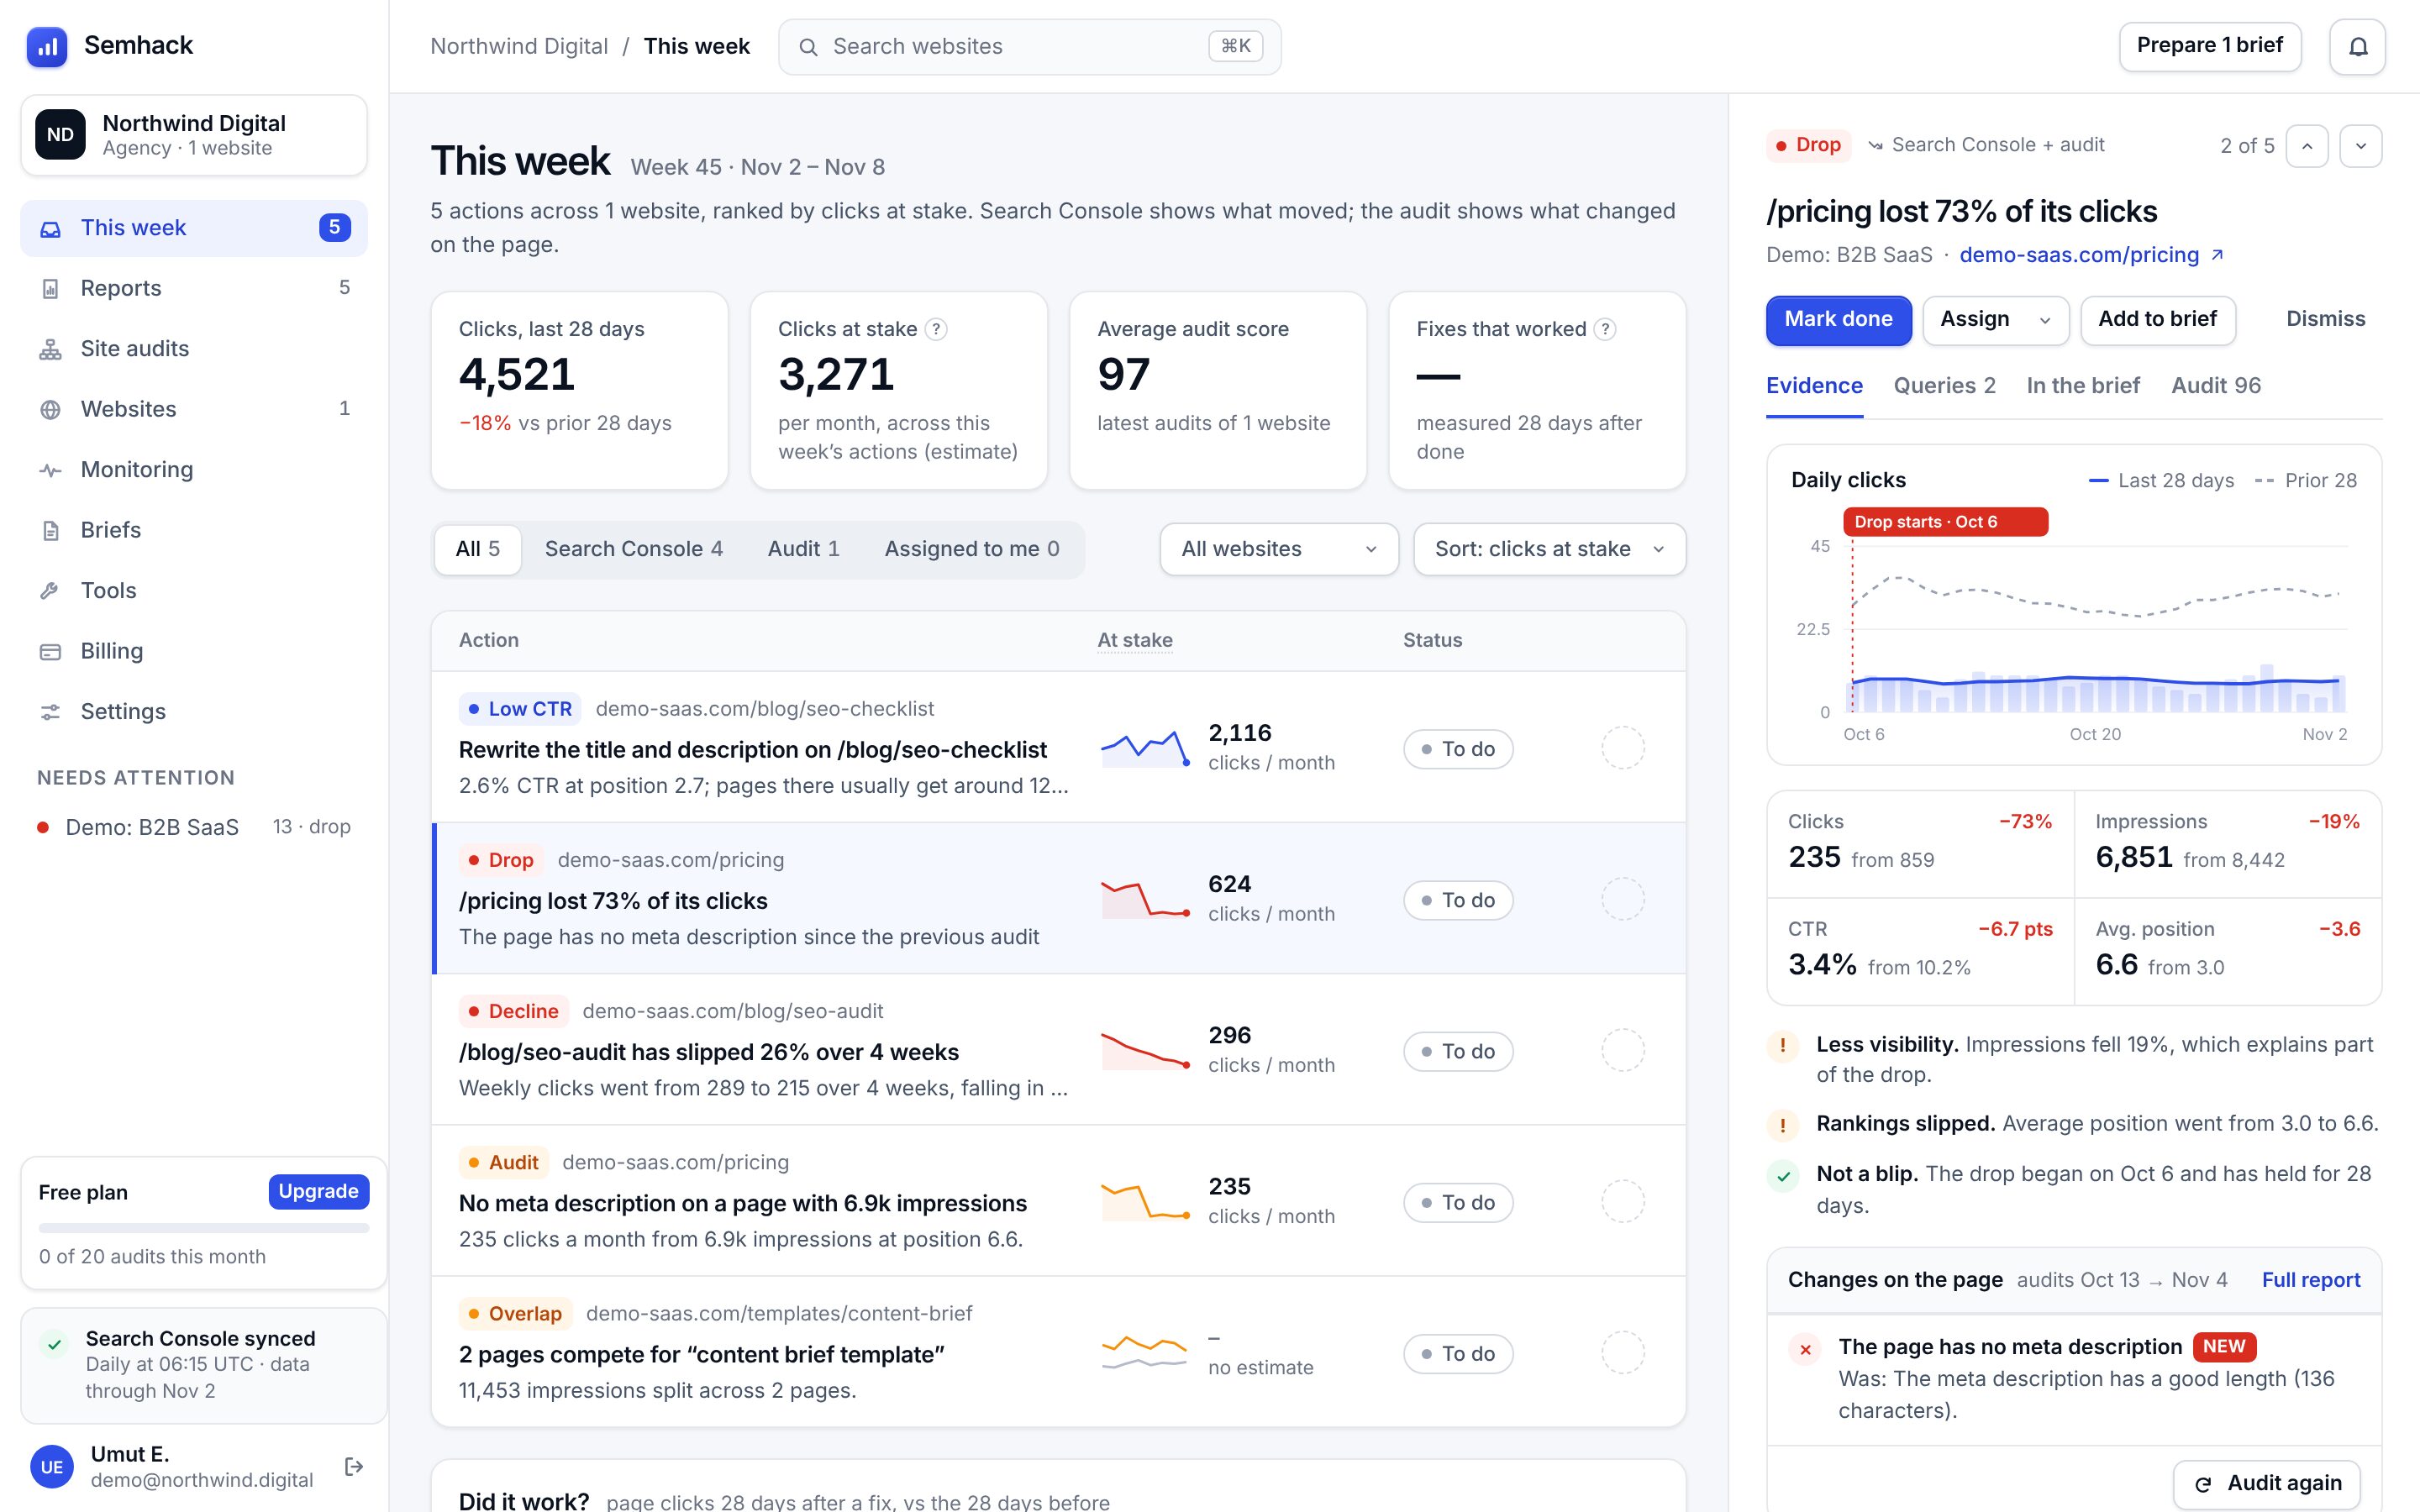
This week
One list across every client, ranked by clicks at stake.
Filter by Search Console or audit findings, by website, to what’s assigned to you or to what’s due this week. Open any action for its daily clicks chart, the four metrics for both periods, the queries that moved, and what changed on the page between audits. Then mark it done, assign it, give it a due date, comment on it, add it to the client’s brief, or dismiss it.
What it looks for
Fixed rules you can read, not a black box.
The same data always gives the same list. Every rule has minimum traffic thresholds, so a page with a handful of clicks doesn’t raise an alarm.
| Action | When it appears | Clicks at stake |
|---|---|---|
| Drop | A page lost at least 30% of its clicks (and at least 20 clicks) in the last 28 days, compared with the 28 before. Pages with fewer than 40 clicks before are skipped. | At stake: The clicks it lost |
| Slow decline | Weekly clicks fell at least 15% over four weeks, lower than the week before in at least three of them. Catches slides a 28-day comparison misses. | At stake: The weekly loss × 4 |
| Low CTR | The page ranks in the top 5 with at least 300 impressions, but gets less than half the click-through rate that position usually earns. | At stake: Clicks at the usual rate for its position, minus today’s |
| Near miss | A query where the page ranks between positions 8 and 20 with at least 200 impressions: close enough to page one to be worth a push. | At stake: Clicks at position 5’s usual rate, minus today’s |
| Overlap | Two or more of your pages split the impressions for the same query, each with a real share. Often a sign they compete with each other. | At stake: No estimate |
| Audit | A failing high- or medium-importance check on a page that gets search traffic, up to three per page, most important first. | At stake: All of the page’s clicks in the last 28 days |
Clicks at stake
An estimate, labelled as one.
What it is
A rough number of clicks per month that an action is worth, so a big problem on a small page doesn’t outrank a small problem on your best page.
How it’s worked out
Each action type has its own formula, shown in the table above and next to the number in the app. The “usual rate for a position” is a typical click-through curve, used only to spot rates far below normal.
What it isn’t
A forecast. Fixing a page doesn’t guarantee those clicks; the number is there to decide what to look at first.
Did it work?
Mark it done. Get an answer 28 days later.
- Compares the page’s clicks in the 28 days after the fix with the 28 days before
- Waits until those 28 days of data exist, since Search Console lags a few days
- Changes within ±3% count as “No change”; losses are shown too
- /shop/cold-brew+41% clicksNew title and description · 2,013 → 2,846
- /guides/pour-overNo changeMerged two overlapping guides · 1,240 → 1,262
- /wholesale+368% clicksRemoved the noindex tag · 88 → 412
- /blog/grind-size−8% clicksAdded an H1 and alt text · 530 → 489
It shows what happened to clicks, not why: seasonality and other changes in the same weeks count too.
Connecting
Read-only, and out of your way.
Read-only Google access
When you connect, Semhack asks Google only for read-only Search Console access. It can read performance reports and the list of properties; it can’t change settings, users or anything on the site.
100 days of history
Each property you pick becomes a client with its last 100 days imported, enough for two full 28-day comparisons, then a daily sync.
Demo client
Don’t want to connect yet? Add the demo client, a sample B2B SaaS site with realistic data, and explore the list and briefs first.
Honest limits
What it doesn’t do
- It works with the data Search Console provides, including its usual delay of a few days and its privacy filtering of rare queries.
- Rules flag patterns in the numbers; they don’t know about your releases, campaigns or Google updates. Each action says what it saw so you can judge it.
- “Did it work?” shows what happened to clicks after a fix, not proof that the fix caused it. Seasonality and other changes in the same weeks count too.
- No live rank checks or keyword research: positions come from Search Console, for queries the site already appears for. To follow chosen queries over time, use keyword tracking.
The rest of Semhack
- Site audit40 checks on any page, a crawl of the whole site, and Core Web Vitals from PageSpeed Insights.Learn more
- Explorer and keywordsEvery page and query of a client’s Search Console data, and the keywords you choose to follow week by week.Learn more
- Competitor comparisonYour page next to up to three competitor pages: scores, checks where you’re behind and words they use that you don’t.Learn more
- Monitoring and alertsUptime every few minutes, SSL expiry, scheduled re-audits and alerts when something important breaks.Learn more
- Client reportsWeekly briefs and audit report links in your own branding, scheduled client emails, CSV exports and printable reports.Learn more
- Team and collaborationInvite teammates with roles, then comment, @mention, set due dates and work the board together.Learn more
- API and integrationsA REST API with scoped keys, signed webhooks and Slack messages for audits, findings and alerts.Learn more
See your own weekly list.
Connect Search Console, or start with the demo client. The free plan covers one site.